


In nearly every distressed situation, one of the first things put in place is a 13-week cash flow forecast. A critical tool for distressed companies, the 13-week forecast gives stakeholders a real-time view of the company’s liquidity runway. Ample liquidity can give a Board time to explore its strategic options, while limited liquidity typically foreshadows a near-term restructuring.
Despite their ubiquity, no two 13-week forecasts look alike. Models are architected differently, contain varying levels of detail or support schedules, and don’t always even forecast the same view of “cash” (some forecasts predict a company’s ending bank balance, while others predict “book” balance, which includes outstanding checks).
Lenders typically insist that distressed debtors prepare 13-week forecasts, relying upon boilerplate language found in most credit agreements that give them this right. And debtors comply.
If it’s inevitable that lenders will receive many 13-week forecasts, and that no two looks alike, how best can lenders gain the most value from the limited time they have to review them? The authors identified five things lenders can do that will improve the quality of the forecasts they receive and the time they spend reviewing them:
- Understand forecast accuracy
- Identify one-time items
- Compare to the prior forecast
- Understand timing variance
- Limit the “other"
This article will focus on #1: Understand forecast accuracy, while exploring the other topics in the subsequent discussion.
The series will focus on a hypothetical company called Sarabeth’s, a retailer of apparel and accessories. Like many retailers these days, Sarabeth’s is in trouble. Store traffic has declined in many of the company’s mall-based locations; online sales, once hoped to be the future for the company, have plateaued and comp’d negative last year; and liquidity has gotten tight. The company began offering a loyalty program last year and reduced the number of overhead positions but nevertheless tripped a maximum leverage covenant in the 4th quarter of 2017.
The agent on Sarabeth’s credit facility, J.P. Fargo (JPF), began requiring the debtor to publish a 13-week cash forecast each week. John Pierpont, the head of special assets for JPF, is responsible for monitoring the progress of Sarabeth’s and leading the restructuring from the lenders’ side. The form of the 13-week forecast he received looked like this:
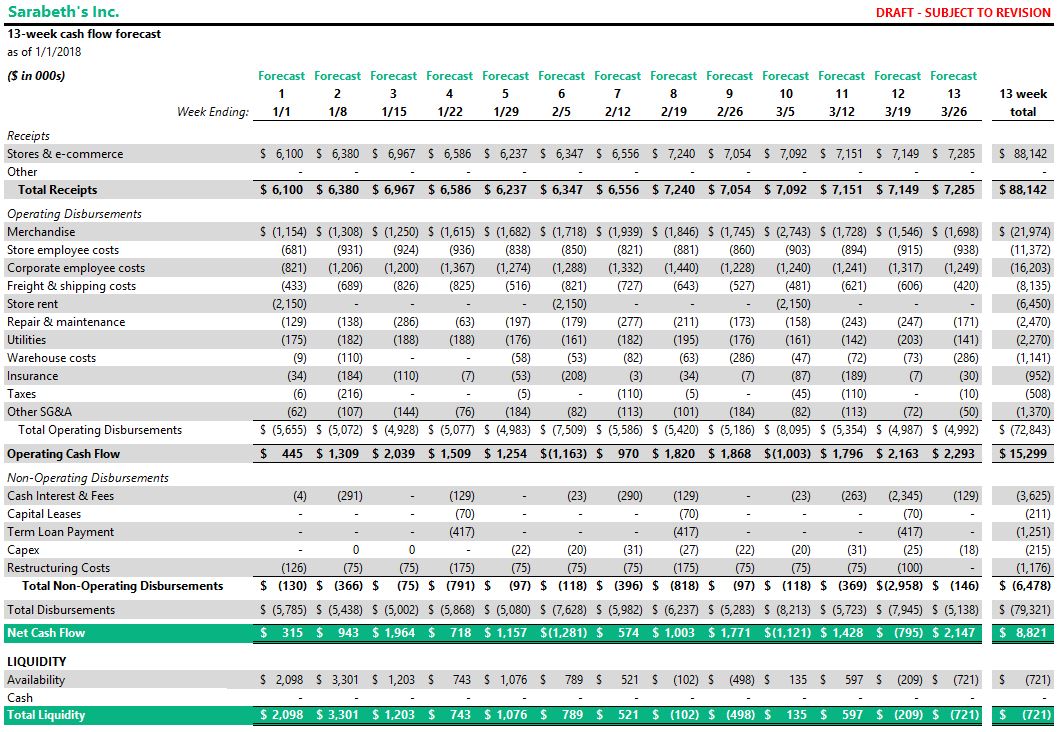
Figure 1: Sarabeth's 13-week cash flow forecast
The first place lenders usually look when reviewing a forecast is the bottom line: the projected liquidity balance each week. While obviously important, this number alone is not meaningful without further context.
Consider the forecast that Pierpont received from Sarabeth’s management. Figure 2 summarizes the projected total liquidity balance. Per the forecast, Sarabeth’s has around 8 weeks before it will experience negative liquidity.

Figure 2: Projected liquidity balance
Before taking further action, however, lenders must gain further understanding of the cash flow forecast’s accuracy. The best way of doing this is by requiring borrowers to publish a cumulative variance analysis, which measures the total variance of actual results to an earlier period’s forecast (typically 4-8 weeks prior). By measuring 4-8 weeks of variance, lenders can eliminate many of the timing variances that distort weekly forecasts and get a better picture of how accurate the overall process is.
In the illustrative case, when Sarabeth’s management measures their last 4 weeks against actual results, they discover that they overestimated receipts by $300k (a 1.2% variance), and underestimated disbursements by $500k (a 2.3% variance). See figure 3.

Figure 3: Cumulative variance analysis
While these errors may seem minor, if the issue is systemic, the cumulative effect could be quite significant. Sarabeth’s management team adjusted its forecast to decrease receipts by $75k per week and increase disbursements by $125k per week. Both the original and revised forecasts are plotted in Figure 4.

Figure 4: Revised liquidity projections
The revised forecast makes the magnitude of these forecasting errors clear. Now, the company is projected to run out of liquidity in week 4, not week 8.
The next article in this series will focus on the next thing lenders can do to improve the quality of the cash flow reporting they receive: identifying one-time items.